 EMODnet Product Catalogue
Bio-geographical regions
Type of resources
Available actions
Topics
Keywords
Contact for the resource
Provided by
Years
Formats
Representation types
Update frequencies
status
Scale 1:
-
The marine habitat type data concerns the modelling work carried out within the Finnish Inventory Programme for the Underwater Marine Environment (VELMU) in spring 2015. The task was done in cooperation between the Geological Survey of Finland (GTK) and Åbo Academi University (ÅA). The work included the modelling of the marine habitats included in the Annex 1 of the Habitats Directive: reefs (1170) and sandbanks, which are slightly covered by sea water all the time (1110). The aforementioned marine habitat types are specified on the basis of seabed substrate type and topographic form and they can overlap one another. The objective was to produce comprehensive maps of the occurrences of reefs and sandbanks throughout the entire marine area of Finland based on the best data available. The criteria to determine the marine habitats were discussed with the responsible bodies and the instructions (version 5.1), which include more precise criteria for determining marine habitat types than the Natura 2000 Habitats Manual (Airaksinen & Karttunen 2001), for a Natura 2000 inventory were utilised. On the basis of different criteria and test analyses, a decision was made to model potential sandbanks which includes sites that are likely to have sandbank occurrences. The data covers only the Northern Bothnian Sea.
-
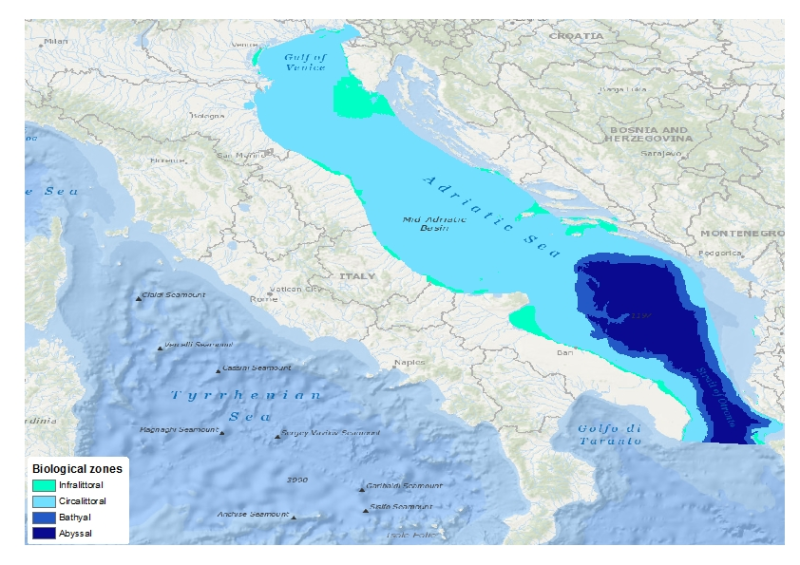
This layer is a model of the biological zones of the Adriatic Sea. It was performed within the framework of EMODnet Phase 2 Thematic Lot n┬░ 3 (aka EUSeaMap2). It is a preliminary version which will be refined during the course of the project. This layer was modelled with the use of base layers that were the seabed substrate type (obtained from EMODnet phase 2 Geology lot, June 2014 release), the bathymetry (EMODnet phase 1 Hydrography lot) and the kdpar (bespoke computed layer) The biological zones boundaries were defined in the following way. - Infralittoral lower limit: limit at which the percentage of light reaching the seabed is 1%. The percentage of light layer was calculated by intersecting the kdpar and the bathymetry layers. For more details about this calculation see e.g. Cameron and Askew (2011). - Circalittoral lower limit: break of slope due to the entrance into the continental slope. This limit was digitalized with the use of the bathymetry layer - Bathyal lower limit: break of slope due to the entrance into the abyssal plain. This limit was digitalized with the use of the bathymetry layer In a western area for which the seabed substrated type is influenced by the P├┤ river, different rules were used for the definition infralittoral and circalittoral zones. Where the substrate is muddy (i.e. mud or sandy mud) and/or the seabed is deeper than 20 meters then the biological zone was said to be circalittoral. Elsewhere it was defined as infralittoral. For more details about the current layer see EUSeaMap first year report (EMODnet Thematic Lot n┬░ 3, 2014) Cameron, A., Askew, N. (eds.), 2011. EUSeaMap - Preparatory Action for development and assessment of a European broad-scale seabed habitat map final report. URL: http://jncc.gov.uk/euseamap EMODnet Thematic Lot n┬░ 3, 2014. EMODnet Phase 2 - Annual (interim) report. Reporting Period: Sept. 2013 to Aug. 2014. URL: http://www.emodnet-seabedhabitats.eu/pdf/20140909_euseamap2_year1_report.pdf
-
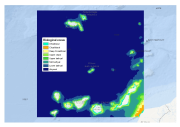
This layer is a predictive EUNIS seabed habitat map for the Canary Islands. It was performed within the framework of EMODnet Phase 2 Thematic Lot n┬░ 3 (aka EUSeaMap2). It is a preliminary version which will be refined during the course of the project. The layer was created using two pre-processed input datasets: substrate and biological zone. The seabed substrate type layer was a compendium of historical maps (Emodnet phase 2 Geology lot first release + Datasets from Instituto Espa├▒ol de Oceanograf├¡a). The biological zones layer, available in this catalog under the title 'Biological zones of the Canary Islands and Madeira archipelago', was modeled thanks to layers of bathymetry and light attenuation. The map follows the EUNIS 2007-11 classification system supplemented by additional categories in deep sea areas (Howell et al., 2010). The map does not include the intertidal zone. The study followed the methodology developped within the EUSeaMap project (EMODnet phase 1). For more details about the methodology see EUSeaMap final report (Cameron and Askew, 2011) or Coltman et al., 2008. For more details about the current map see EUSeaMap2 interim report (EMODnet Thematic Lot n┬░ 3, 2014) Cameron, A., Askew, N. (eds.), 2011. EUSeaMap - Preparatory Action for development and assessment of a European broad-scale seabed habitat map final report. URL: http://jncc.gov.uk/euseamap Coltman, N., Golding, N., Verling, E., 2008. Developing a broadscale predictive EUNIS habitat map for the MESH study area. 16 pp. URL: https://www.emodnet-seabedhabitats.eu/resources/mesh-archive/. EMODnet Thematic Lot n┬░ 3, 2014. EMODnet Phase 2 - Annual (interim) report. Reporting Period: Sept. 2013 to Aug. 2014. URL: http://www.emodnet-seabedhabitats.eu/pdf/20140909_euseamap2_year1_report.pdf Howell, K.L., 2010. A benthic classification system to aid in the implementation of marine protected area networks in the deep/high seas of the NE Atlantic. Biological Conservation 143, 1041ÔÇô1056.
-
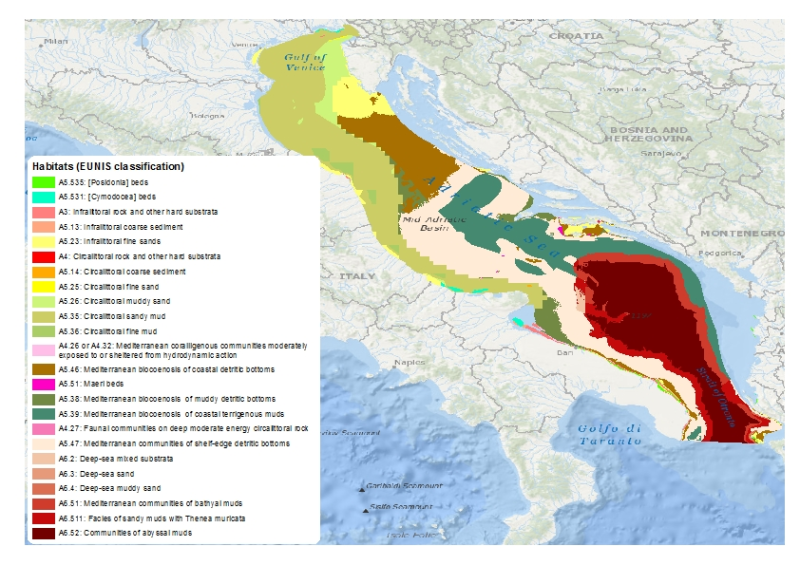
This layer is a predictive EUNIS seabed habitat map for the Adriatic Sea. It was performed within the framework of EMODnet Phase 2 Thematic Lot n┬░ 3 (aka EUSeaMap2). It is a preliminary version which will be refined during the course of the project. The layer was created using two pre-processed input datasets: substrate and biological zone. The seabed substrate type layer was a compendium of historical maps (Emodnet phase 2 Geology lot first release + IBCM map). The biological zones layer, available in this catalog under the title 'Biological zones of the Adriatic Sea', was modeled thanks to layers of bathymetry and light attenuation. The map follows the EUNIS 2007-11 classification system. It does not include the intertidal zone. The study followed the methodology developped within the EUSeaMap project (EMODnet phase 1). For more details about the methodology see EUSeaMap final report (Cameron and Askew, 2011) or Coltman et al., 2008. For more details about the current map see EUSeaMap2 interim report (EMODnet Thematic Lot n┬░ 3, 2014) Cameron, A., Askew, N. (eds.), 2011. EUSeaMap - Preparatory Action for development and assessment of a European broad-scale seabed habitat map final report. URL: http://jncc.gov.uk/euseamap Coltman, N., Golding, N., Verling, E., 2008. Developing a broadscale predictive EUNIS habitat map for the MESH study area. 16 pp. URL: https://www.emodnet-seabedhabitats.eu/resources/mesh-archive/. EMODnet Thematic Lot n┬░ 3, 2014. EMODnet Phase 2 - Annual (interim) report. Reporting Period: Sept. 2013 to Aug. 2014. URL: http://www.emodnet-seabedhabitats.eu/pdf/20140909_euseamap2_year1_report.pdf
-
This layer is a model of the biological zones of the Canary Islands and Madeira archipelago. It was performed within the framework of EMODnet Phase 2 Thematic Lot n┬░ 3 (aka EUSeaMap2). It is a preliminary version which will be refined during the course of the project. This layer was modelled with the use of base layers that were the bathymetry (Gebco_08) and the kdpar (bespoke computed layer) The biological zones boundaries were defined in the following way. - Infralittoral lower limit: limit at which the percentage of light reaching the seabed is 1%. The percentage of light layer was calculated by intersecting the kdpar and the bathymetry layers. For more details about this calculation see e.g. Cameron and Askew (2011). - Circalittoral lower limit: depth 80m - Deep circalittoral lower limit: depth 200m - Upper slope lower limit: depth 750m - Upper bathyal lower limit: depth 1100m - Mid bathyal lower limit: depth 1800m - Lower bathyal lower limit: depth 2700m Deep biological zones (from upper slope to abyssal) were chosen according to the classification proposed by Howell (2010). For more details about the current layer see EUSeaMap first year report (EMODnet Thematic Lot n┬░ 3, 2014) Cameron, A., Askew, N. (eds.), 2011. EUSeaMap - Preparatory Action for development and assessment of a European broad-scale seabed habitat map final report. URL: http://jncc.gov.uk/euseamap EMODnet Thematic Lot n┬░ 3, 2014. EMODnet Phase 2 - Annual (interim) report. Reporting Period: Sept. 2013 to Aug. 2014. URL: http://www.emodnet-seabedhabitats.eu/pdf/20140909_euseamap2_year1_report.pdf Howell, K.L., 2010. A benthic classification system to aid in the implementation of marine protected area networks in the deep/high seas of the NE Atlantic. Biological Conservation 143, 1041ÔÇô1056.
-
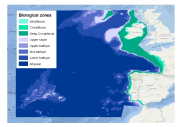
This layer is a model of the biological zones of the EU's 'Atlantic Area 2007-2013'. It was performed within the framework of MeshAtlantic project (INTERREG ÔÇÿAtlantic Area 2007-2013ÔÇÖ program). This layer was modelled with the use of bespoke base layers that were the bathymetry, wave wavelength and the kdpar The biological zones boundaries were defined in the following way. - Infralittoral lower limit: limit at which the percentage of light reaching the seabed is 1%. The percentage of light layer was calculated by intersecting the kdpar and the bathymetry layers. For more details about this calculation see e.g. Vasquez et al. (in press). - Circalittoral lower limit: limit at which the ratio wave wave length over the depth equals 2.53 - Deep circalittoral lower limit: break of slope due to the entrance into the continental slope. This limit was digitalized with the use of the bathymetry layer - Upper slope lower limit: depth 750m - Upper bathyal lower limit: depth 1100m - Mid bathyal lower limit: depth 1800m - Lower bathyal lower limit: break of slope due to the entrance into the abyssal plain. This limit was digitalized with the use of the bathymetry layer Deep biological zones (from upper slope to abyssal) were chosen according to the classification proposed by Howell (2010). For more detail see Vasquez et al. (in press) Howell, K.L., 2010. A benthic classification system to aid in the implementation of marine protected area networks in the deep/high seas of the NE Atlantic. Biological Conservation 143, 1041ÔÇô1056. Vasquez, M., Mata Chac├│n, D., Tempera, F., OÔÇÖKeeffe, E., Galparsoro, I., Sanz Alonso, J. L., Gon├ºalves, J.M.S., Bentes, L., Amorim, P., Henriques, V., McGrath, F., Monteiro, P., Mendes, B., Freitas, R., Martins, R., Populus, J., In press. Broad-scale mapping of seafloor habitats in the north-east Atlantic using existing environmental data.
-
This layer is a predictive EUNIS seabed habitat map for the Atlantic area. The layer has been created using three pre-processed input datasets: substrate, biological zone and energy. The seabed substrate type layer is a compendium of historical maps. The biological zones layer was modeled thanks to layers of bathymetry, light attenuation, and wave wavelength. The layer of energy was prepared thanks to archived results of numerical models of waves and currents. The map follows the EUNIS 2007-11 classification system supplemented by additional categories in deep sea areas (Howell et al., 2010). The map does not include the intertidal zone. The study followed the methodology developped within the EUSeaMap project. For more details about the methodology see EUSeaMap final report (Cameron and Askew, 2011) or Coltman et al., 2008 For more details about the substrate and bathymetry that were used as a basis see Mata Chac├│n et al. Cameron, A., Askew, N. (eds.), 2011. EUSeaMap - Preparatory Action for development and assessment of a European broad-scale seabed habitat map final report. URL: http://jncc.gov.uk/euseamap Coltman, N., Golding, N., Verling, E., 2008. Developing a broadscale predictive EUNIS habitat map for the MESH study area. 16 pp. URL: https://www.emodnet-seabedhabitats.eu/resources/mesh-archive/. Howell, K.L., 2010. A benthic classification system to aid in the implementation of marine protected area networks in the deep/high seas of the NE Atlantic. Biological Conservation 143, 1041ÔÇô1056. Mata Chac├│n, D., Sanz Alonso, J.L., Gon├ºalves, J.M.S., Monteiro, P., Bentes, L., McGrath, F., Henriques, V., Freitas, R., Amorim, P., Tempera, F., Fossecave, P., Alonso, C., Galparsoro, I., Vasquez, M., Populus, J. (2013). Report on collation of historic maps. Bathymetry, substrate and habitats ÔÇô MeshAtlantic Report. Spanish Institute of Oceanography. 98 pp.